Are Americans Getting Richer or Poorer?
Based on a YouTube Video Literature Review by Creator “Eco Gecko”
In this post, I’ll make use of a literature review completed in a non-traditional format: a YouTube video by creator “Eco Gecko” (available here), who attempts to answer this question “Are Americans richer or poorer than they were 40 years ago?” This blog entry is Part 1 of a 3-part series about America’s income inequality and its causes
Before we begin, here are some terms we’d like to clarify:
Real income: Real income is how much money an individual earns after accounting for inflation. Since inflation has been generally trending upwards for the past few decades, real income usually results in a lower value than non-adjusted income.
Average vs. median: These are both ways of finding the typical or middle value of a set of data (for our purposes, usually income). Average is more skewed by extreme numbers, but median isn’t as affected by extremes. We will be using both average and median to look at data, but when we’re looking at all US workers, we’ll stick to median. When we’re looking at certain groups of earners–highest, lowest, middle 30%, whatever it may be–we can use averages without worrying about extremes.
Compensation vs. wages: Compensation is the amount of cash and any other financial benefits you receive from your employer. Besides your hourly or salaried wages, compensation can include commissions, tips, overtime, bonuses, and, of course, benefits such as insurance, vacation policy, sick leave, and more. Wages, or base pay, is the amount you are paid by your employer BEFORE taxes and benefits are taken into account.
GDP: Gross Domestic Product, or a country’s economic output. The value of goods and services produced minus the value of what’s needed to produce them (labor, raw materials, etc). This will mostly be talked about in the context of “per capita” GDP, which is the output per person.
Okay, let’s dive in!
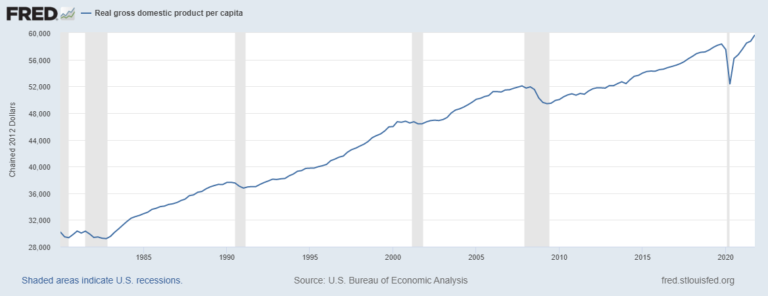
The Federal Reserve Economic Data (FRED) reported that the per capita GDP has nearly doubled between 1980 to 2020. If workers are paid by their productivity, we would expect that individual incomes would double as well. So–have they?
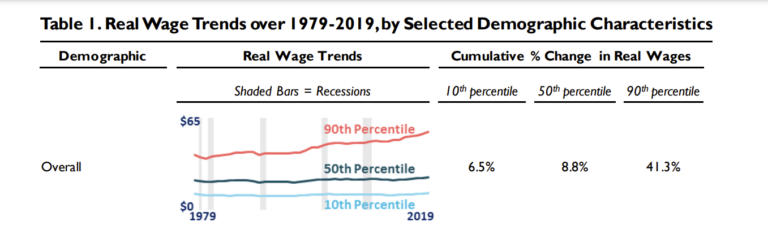
There is no short answer: it varies. Most Americans saw that over the past 40 years, their real median wages only grew around 9%. The lowest-earning 10% of American workers only saw their wages grow by around 6.5%, and the highest-earning 10% of American workers saw their wages grow by around 41%. Looks like individual incomes did increase–but only for those who were already earning more than 90% of other Americans.
One study decided to spit up Americans into groups based on their income. This allowed them to use averages without having to worry about the very high extremes of the top 10% of earners.
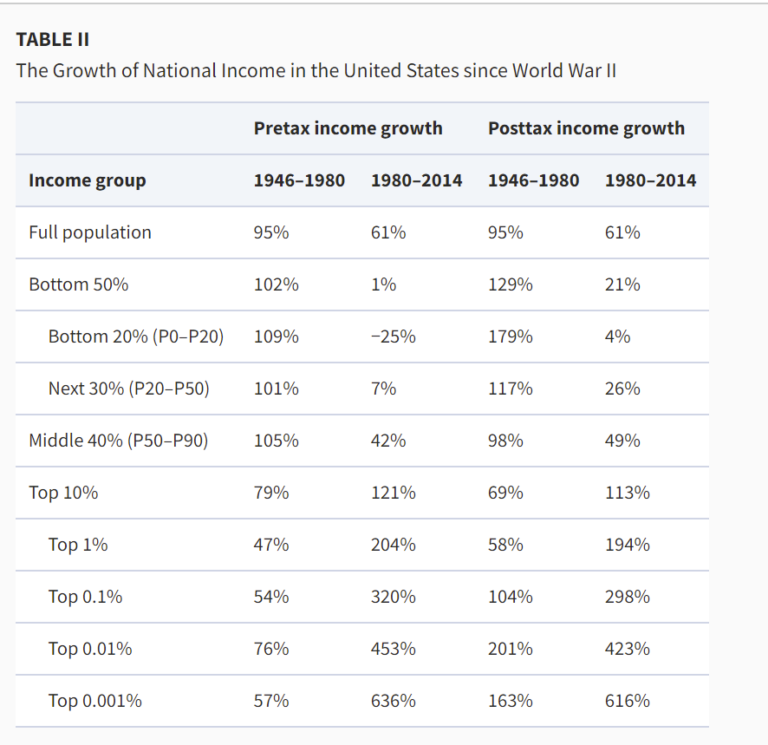
For the Americans in the lowest-earning 20%, their average real income actually DECREASED by around 25% between 1980-2014. For the highest-earning 10% of Americans, however, it grew by around 110%. Remember– this is all occurring over a time period where our per capita GDP nearly doubles. So what does this mean for most workers? For all Americans except the highest-earning 13%, income grew more slowly than the economy. In simple terms: the vast majority of Americans did not see their wages grow at the same rate as their productivity.
However, wages are not the only thing a job provides. It’s also important to look at compensation, which includes not only wages but also health insurance, paid holiday, sick leave, etc. Since 1982, the average hourly compensation of the American worker has tripled–but we should know the problem with using averages to generalize to the entire population by now! When we break it down by percentiles (a safer application of averages, for these purposes), benefit growth is even MORE skewed to the rich than wage growth. Benefit inequality between the highest-earning and lowest-earning 10% of Americans is 3x higher than wage inequality. Compared to 1982, employers are less likely to provide pensions, paid vacation and health insurance. Health insurance as a proportion of compensation costs has doubled between 1982–2015, which explains why employers are less likely to provide it. On the bright side, employers are more likely to provide paid sick leave and bonuses, but any growth in compensation between these years is mostly eaten up by rising healthcare costs.

Putting it all together...
We can draw some pretty nasty conclusions from this. It’s easy to use “average wage growth” to hide what’s really happening: the rich are getting richer, the middle earners are mostly staying the same/decreasing slightly, and the poor are getting poorer. It doesn’t seem to matter if we look at wages or compensation–the results point the same way. Though employers spend more on health insurance than they did in the past, it’s because health insurance costs have risen, leading to a decrease in health insurance coverage in general.
Stay tuned for Part 2 to find out how we got here!